


")


บทความเชิงเทคนิคของ Solis – การเดินระบบและการบำรุงรักษาแบบออนไลน์ (Online O&M)
วิเคราะห์ปัญหาการกระจายตัวของกระแสพลังงานแสงอาทิตย์
ความเป็นมา
โรงไฟฟ้าพลังงานแสงอาทิตย์เป็นสินทรัพย์ที่สร้างรายได้ระยะยาว แม้ว่าการก่อสร้างสามารถทำได้อย่างรวดเร็ว แต่การดำเนินการและบำรุงรักษากินเวลายาวนานตลอดอายุการใช้งานกว่า 25 ปี และโดยเฉพาะหากเป็นโรงไฟฟ้าพลังงานแสงอาทิตย์ขนาดใหญ่ การเดินระบบและการบำรุงรักษา (O&M) จะยิ่งมีความยุ่งยากมากขึ้นเมื่อเทียบกับโรงไฟฟ้าพลังงานแสงอาทิตย์ขนาดเล็ก และในระยะแรกอาจพบปัญหาสะสมของส่วนประกอบและอุปกรณ์ต่างๆและปัญหาจากคุณภาพการก่อสร้างอีกด้วย ปัจจัยเหล่านี้จะส่งผลต่อรายได้จากการผลิตไฟฟ้าในระยะหลังของการดำเนินการโรงไฟฟ้า ดังนั้น บทความของ Solis ชิ้นนี้ จะมุ่งเน้นไปที่วิธีการใช้เครื่องมือดิจิทัลเพื่อช่วยสนับสนุนการปฏิบัติงานเดินระบบประจำวัน
วิเคราะห์ปัญหาการกระจายตัวของแสงอาทิตย์อะไร?
วิเคราะห์ภาพรวมของปัญหาการกระจายตัวของกระแสจากแผงพลังงานแสงอาทิตย์ส่วนใหญ่จะใช้เพื่อประเมินความสอดคล้องในการผลิตไฟฟ้าของแผงพลังงานแสงอาทิตย์และประสิทธิภาพในการใช้งานจริง จะสะท้อนถึงสถานการณ์ปัจจุบันของวงจรไฟฟ้ากระแสตรงแต่ละสาขาของอินเวอร์เตอร์ เมื่ออัตราการกระจายตัวในปัจจุบันต่ำ แสดงว่าประสิทธิภาพการผลิตไฟฟ้าของแต่ละสาขามีความสม่ำเสมอ หากอัตราการกระจายตัวในปัจจุบันสูง แสดงว่าค่าเบี่ยงเบนกระแสสาขามีมาก ซึ่งหมายความว่าสามารถดำเนินการตรวจสอบจุดคงที่ขั้นต่อไปได้
สูตรในการคำนวณการกระจายกระแสของแผงพลังงานแสงอาทิตย์มีดังนี้:
การกระจาย = ค่าเบี่ยงเบนมาตรฐานของกระแสแผงพลังงานแสงอาทิตย์/ค่าเฉลี่ยของกระแสแผงพลังงานแสงอาทิตย์ *100%
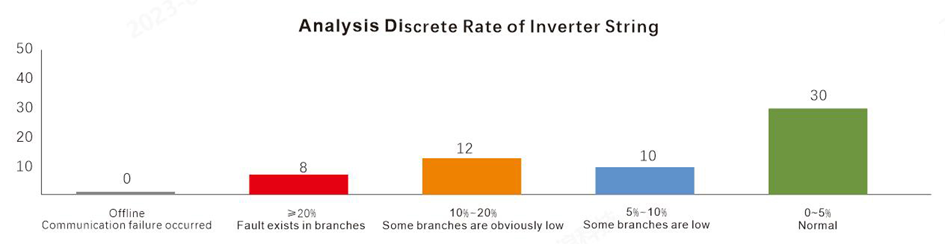
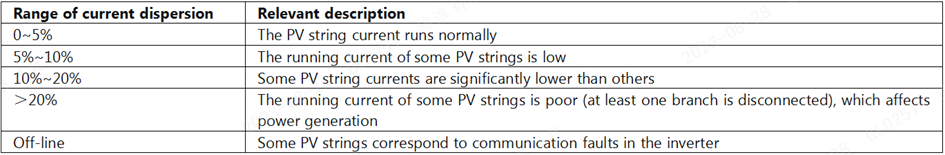
ในแพลตฟอร์มการจัดการข้อมูลโรงไฟฟ้าพลังงานแสงอาทิตย์ อัตราการแยกกระแสไฟฟ้าของแผงพลังงานแสงอาทิตย์จะใช้ค่าเฉลี่ยถ่วงน้ำหนักของอัตราการแยกส่วนในแต่ละช่วงเวลาของวัน เพื่อประเมินอัตราการแยกส่วนตลอดทั้งวัน สำหรับการประเมินค่าการกระจายกระแสของแผงพลังงานแสงอาทิตย์โดยทั่วไปจะแบ่งออกเป็น 5 กรณีต่อไปนี้:
–
การแสดงผลของแอพลิเคชั่นบนหน้าจอ
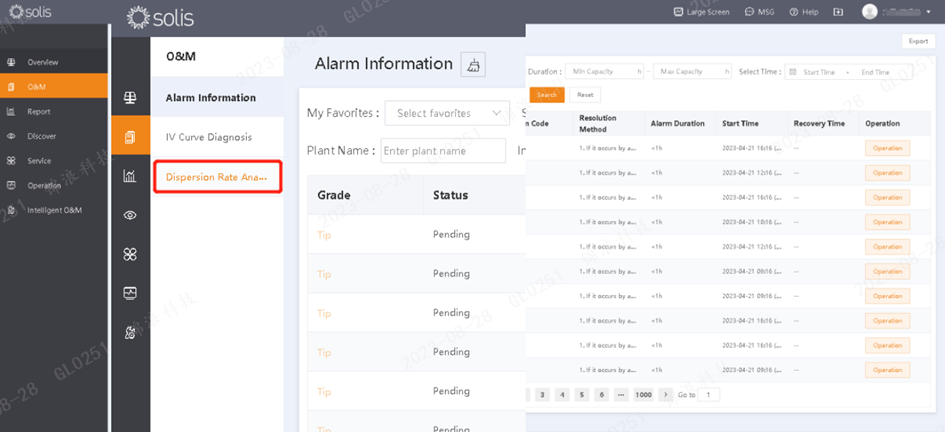
การวิเคราะห์อัตราแยกส่วนส่วนใหญ่สามารถใช้เป็นเครื่องมือที่มีประโยชน์ในการแก้ไขปัญหากำลังและการลดทอนกระแสไฟฟ้าที่เกิดจากการอุดตันของระบบพลังงานแสงอาทิตย์ แผงพลังงานแสงอาทิตย์ที่สกปรก การติดตั้งแผงพลังงานแสงอาทิตย์แบบผสม ความเสียหายของแผงพลังงานแสงอาทิตย์ ฯลฯ การวิเคราะห์อัตราแยกของระบบพลังงานแสงอาทิตย์สามารถทำได้ในศูนย์ปฏิบัติการและบำรุงรักษาของ SolisCloud:
แพลตฟอร์ม SolisCloud → การทำงานและการบำรุงรักษา → การวิเคราะห์อัตราแบบไม่ต่อเนื่อง
–
–
นอกจากนี้ เมื่อใช้เครื่องมือแอปพลิเคชัน ต้องให้ความสำคัญกับปัจจัยต่อไปนี้:
1. แนะนำให้ยกเว้นสถานการณ์สภาพอากาศที่ผิดปกติ เช่น วันที่มีเมฆมากและมีฝนตก เมื่อทำการวิเคราะห์การกระจายตัว
2. อินเวอร์เตอร์แต่ละตัวเชื่อมต่อกับแผงพลังงานแสงอาทิตย์ที่ต่อกันมากกว่าหกแผง
3. สามารถดูการดำเนินงานได้ตั้งแต่ 10.00 น. ถึง 14.00 น. ทุกวัน ดังนั้น จะสามารถตรวจสอบข้อมูลของแต่ละวันได้หลัง 10.00 น.
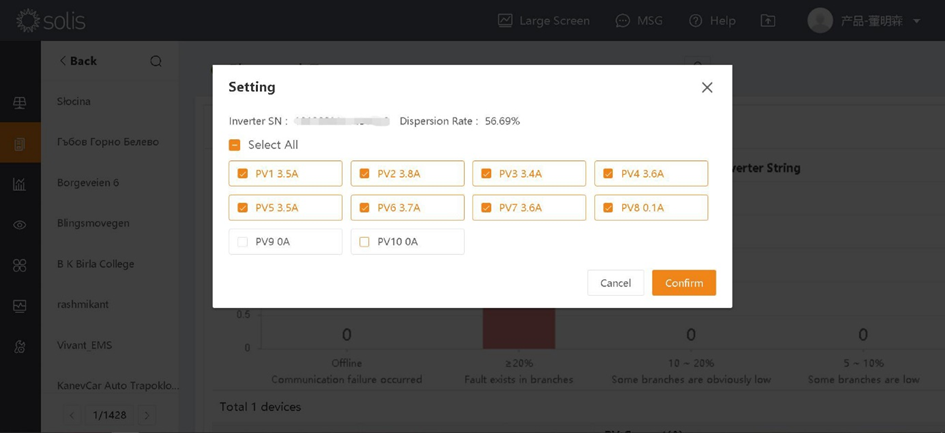
4. สำหรับสาขาที่ไม่ได้เชื่อมต่อกับแผงพลังงานแสงอาทิตย์ ให้ยกเลิกการเลือกก่อนดำเนินการวิเคราะห์เพื่อหลีกเลี่ยงการรบกวน
–
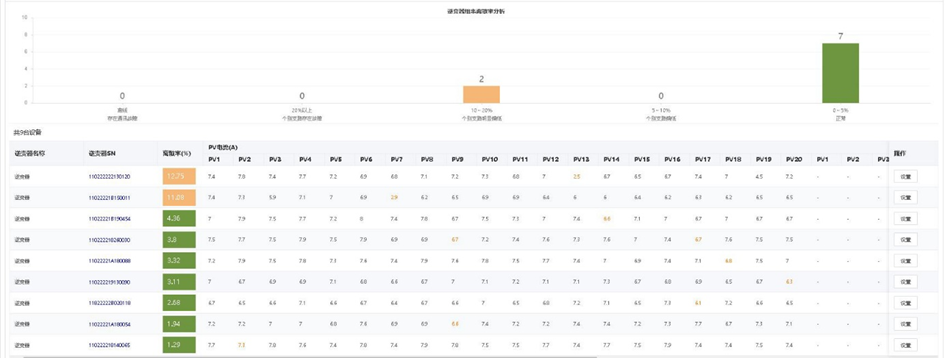
กรณีการเกิดเงาบดบัง: ในกรณีของโรงไฟฟ้าต่อไปนี้ มีอินเวอร์เตอร์ทั้งหมด 9 ตัว จากการวิเคราะห์ อัตราการแยกส่วนของแผงพลังงานแสงอาทิตย์ที่เชื่อมต่อกับอินเวอร์เตอร์สองตัวจะอยู่ระหว่าง 10% ถึง 20% กระแส PV13string และ PV7string ต่ำ ดังนั้นจึงจำเป็นต้องมีการตรวจสอบภาคสนามเพื่อหาสาเหตุ
–
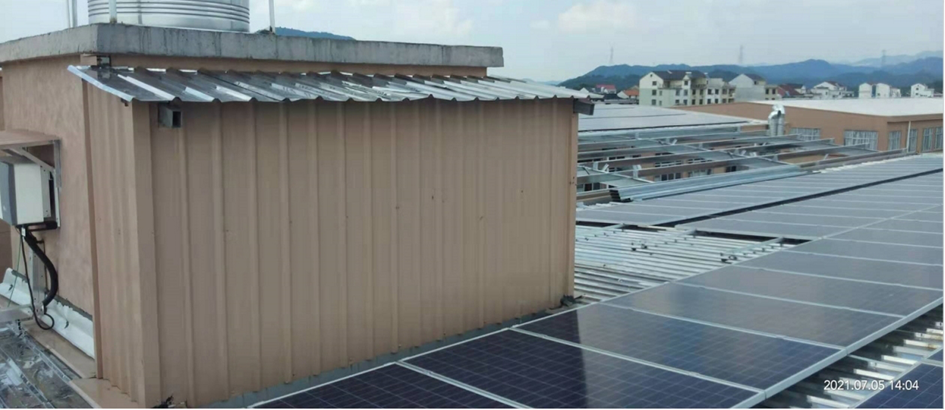
จากการตรวจสอบภาคสนาม จะเห็นได้ว่าแผงพลังงานแสงอาทิตย์ที่สอดคล้องกับอินเวอร์เตอร์สองตัวที่มีอัตราการแยกส่วนสูงมีวัตถุกีดขวาง ซึ่งนำไปสู่การสูญเสียทางไฟฟ้าและการกระจายที่เกิดจากร่มเงาในบางช่วงเวลาของวัน การเกิดเงาบดบังส่งผลให้เกิดช่องว่างระหว่างกระแสที่กำลังทำงานและค่าปัจจุบันของแผงพลังงานแสงอาทิตย์ปกติ และการเพิ่มขึ้นที่สอดคล้องกันในอัตราการแยกส่วน
–
สำหรับการบดบังประเภทนี้ ลูกค้าจำเป็นต้องย้ายและเปลี่ยนแผงพลังงานแสงอาทิตย์ให้เป็นพื้นที่เปิดกว้างมากขึ้น
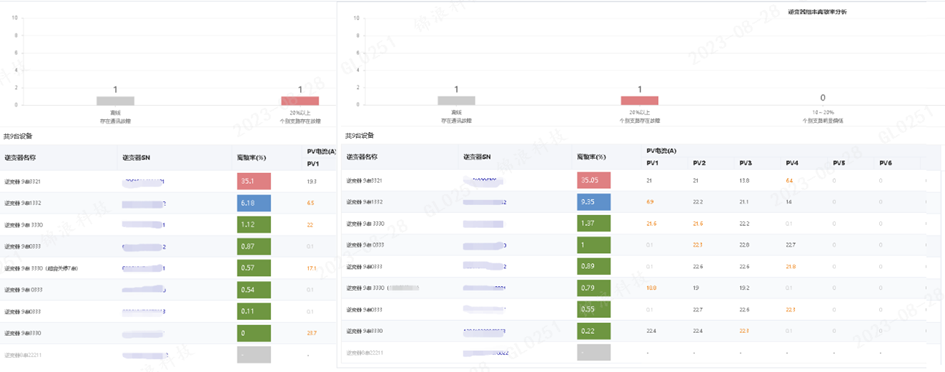
ข้อบกพร่องของแผงพลังงานแสงอาทิตย์: ในกรณีของโรงไฟฟ้าเดียวกัน ยกเว้นอินเวอร์เตอร์ออฟไลน์หนึ่งตัว อัตราการแยกส่วนคือ 6% สำหรับอินเวอร์เตอร์ออนไลน์ 8 ตัว และ 20% สำหรับส่วนประกอบที่เชื่อมต่อ นอกจากนี้ การวิเคราะห์หลายวันของโรงไฟฟ้าได้รับการตรวจสอบอย่างต่อเนื่องและสม่ำเสมอมากกว่า 20% กระแสไฟฟ้าแผงที่สอดคล้องกันของอินเวอร์เตอร์ได้รับการยืนยันว่ามีระดับต่ำ
–
กรณีไม่มีการบดบังเช่นนี้ จะสรุปได้ว่าอาจมีปัญหาบางอย่างกับแผงพลังงานแสงอาทิตย์ จำเป็นต้องมีการตรวจสอบและวิเคราะห์แผงพลังงานแสงอาทิตย์เพิ่มเติม เพื่อแยกแยะว่าพื้นผิวแผงพลังงานแสงอาทิตย์สกปรกหรือมีสาเหตุอื่นของกำลังและการลดทอนกระแสไฟฟ้าก่อนที่จะพิจารณาความผิดปกติ
บทสรุป
การทำงานที่เชื่อถือได้ในระยะยาวของสถานีไฟฟ้าไม่สามารถแยกออกจากการทำงานปกติและการตรวจสอบการบำรุงรักษาได้ เนื่องจากโรงไฟฟ้ามีขนาดใหญ่ ปัญหาจึงมีความหลากหลายและซับซ้อน และการตรวจสอบในสถานที่ในรูปแบบดั้งเดิมจึงใช้เวลานานและยากลำบาก ดังนั้น หากใช้เครื่องมือวิเคราะห์ออนไลน์ต่างๆ เพื่อช่วยเหลือ O&M ได้ โดยเครื่องมือวิเคราะห์การกระจายตัวที่ใช้งานง่ายและเข้าถึงได้สำหรับบุคลากรของโรงไฟฟ้า จะทำให้การทำงานมีผลลัพธ์ที่แม่นยำยิ่งขึ้นโดยออกแรงน้อยลง ซึ่งจะช่วยให้การเดินระบบและการบำรุงรักษารายวัน ตลอดจนการแก้ไขปัญหาต่างๆ ทำได้อย่างมีประสิทธิภาพ
–
Solis : Online O&M
dispersion analysis
Background
PV plants are an incredible asset with long-term income. Their construction is quick, but the time required for operation and maintenance is more than 25 years. Compared with small PV plants, the number and scale of large PV plant components are very big, and late O&M and troubleshooting is increasingly difficult. There can also be an accumulation of problems with equipment selection, construction quality, etc. in the early stage. These factors will affect the revenue of power generation in the later stage of power plant operation. This Solis workshop will focus on how to use digital tools to assist daily operations.
What is dispersion analysis?
PV string dispersion analysis is mainly used to evaluate the consistency of PV string power generation and its performance. In practical applications, it reflects the current situation of each DC branch of the inverter. When the current dispersion rate is low, it indicates that the power generation performance of each branch is consistent. If the current dispersion rate is high, it indicates that the branch current deviation is big, meaning the next stage of fixed-point investigation can be carried out.
The formula for calculating the current dispersion of PV string is as follows:
Dispersion = standard deviation of PV string current/mean value of PV string current *100%
In the PV plant information management platform, the separate rate of PV string current adopts the weighted average of the discretization rate at each moment of the day to evaluate the discretization rate of the whole day. For evaluation of the PV string current dispersion value, it is generally divided into the following five cases:
Scene application
Discrete rate analysis can be mainly used as a helpful tool to troubleshoot power and current attenuation caused by shadow blockage of PV systems, dirty PV panels, mixed PV panel installations, PV panel damage, etc. The discrete rate analysis of the PV system can be performed in the operation and maintenance center of SolisCloud:
SolisCloud platform → operation and maintenance → discrete rate analysis
In addition, when using the application tool you need to pay attention to the following problems:
1. It is suggested to exclude abnormal weather scenarios such as cloudy and rainy days when conducting a dispersion analysis.
2. Each inverter connects to more than six PV strings.
3. The operation viewing time is from 10:00 am to 2:00 pm every day, so you can check the day’s data after 10:00 am.
4. For branches that are not connected to the PV string, deselect them before performing analysis to avoid interference.
Shadow occlusion: In the following power station case, there are a total of 9 inverters. Through analysis, the discretization rate of a PV string connected to two inverters is between 10% and 20%. The PV13string and PV7string currents are low, so field investigation is required to determine the cause.
From field investigation it can be seen that the PV string corresponding to the two inverters with high discretization rates has an object blocking them, which leads to the electrical and distribution losses caused by shade at certain times of the day. The shadow occlusion results in a gap between the running current and the current value of the normal PV string and the corresponding increase in the discretization rate.
For this kind of occlusion, the customer needs to migrate and transform the PV panel to a more open area.
PV panel defects: In the same power station case, except for one offline inverter, the discretization rate is 6% for the 8 online inverters and 20% for the connected components. Moreover, the multi-day analysis of the power station was continuously checked and was consistently more than 20%. The corresponding string current of the inverter was confirmed to be low.
There are no occlusions in this scene, so it can be inferred that there may be some problems with a PV panel. Further investigation and analysis of the PV panel are needed to exclude whether the PV panel surface is dirty or if there are other causes of power and current attenuation before determining the fault.
Conclusion
Long-term reliable operation of the power station cannot be separated from the usual operation and maintenance checks. Since the power station is large, the problems are diverse and complex, and the traditional on-site checks are time-consuming and laborious. If various online analysis tools can be used to assist with O&M, you can get more accurate results with less effort. The power plant dispersion analysis tool is easy to operate and accessible for power plant personnel in terms of daily maintenance and troubleshooting.
–

- Advertisment -.